Well-Defined Entry/Reference Point for Long-Only Traders/Investors

Let me start by expressing my deep sympathy for the affected people in Japan. We should all stand by them and extend our supportive hands at this hour of misery.

On the market front, the intra-day low of SPX was just above its 100-day MA. Long-only traders who were waiting for a correction may get long at this point with a stop-loss just underneath 1259 on SPX. This is a great reference point to trade around.

Posted in Broader Market Analysis | Leave a comment

Revisiting Our Bearish Trade on the Market

Chart of SPY (SPDR S&P 500 ETF, generally corresponds to the price and yield performance of the S&P 500 Index):

Chart of the VIX (CBOE SPX Volatility Index):

On Feb 28, 2011, when the SPY was trading at 132.64 and the VIX was trading at 19.04, we initiated the following positions:

1) Buy the March Quarterly 132/129 Put Spread on SPY for 0.95 for a potential Max gain of 2.05 (minus commissions) if SPY trades at or below 129-strike by March 31, 2011.

2) Buy the March 20/24 VIX Call Spread for 0.85 for a potential Max gain of 3.15 if VIX trades above 24 by March expiration.

Both the trades must have helped you protect your portfolio during the past couple of weeks of choppy trading.

It is interesting to note that the S&P500 closed below its 50-day MA today. The VIX closed right under its 200-day MA (remember: S&P500 and VIX have opposite behavior). Tomorrow is going to be an extremely interesting trading day. If the market can not pull back up from here, it may test the 1275-level on SPX (SPY 127.5). So monitor your positions properly.

Posted in Broader Market Analysis | Leave a comment

Bearish Put Spread on SPY (or Call Spread on VIX)

Chart of SPY (SPDR S&P 500 ETF, generally corresponds to the price and yield performance of the S&P 500 Index):

Chart of the VIX (CBOE SPX Volatility Index):

If you have been following the recommendations of optionsmojo.com, you have already experienced decent gain in the market. Although S&P500 still looks cheap (valuation) at this level, given the run up we have had, combined with the unrest in Northern Africa and Middle East, it is prudent to hedge our portfolio (or even take a short-term bearish bet).

You may consider one of the following two trades (or both):

1) Buy the March Quarterly 132/129 Put Spread on SPY for 0.95 for a potential Max gain of 2.05 (minus commissions) if SPY trades at or below 129-strike by March 31, 2011.

2) Buy the March 20/24 VIX Call Spread for 0.85 for a potential Max gain of 3.15 if VIX trades above 24 by March expiration.

Posted in Broader Market Analysis | Leave a comment

Putting Today’s 4% Correction in JPM into Perspective

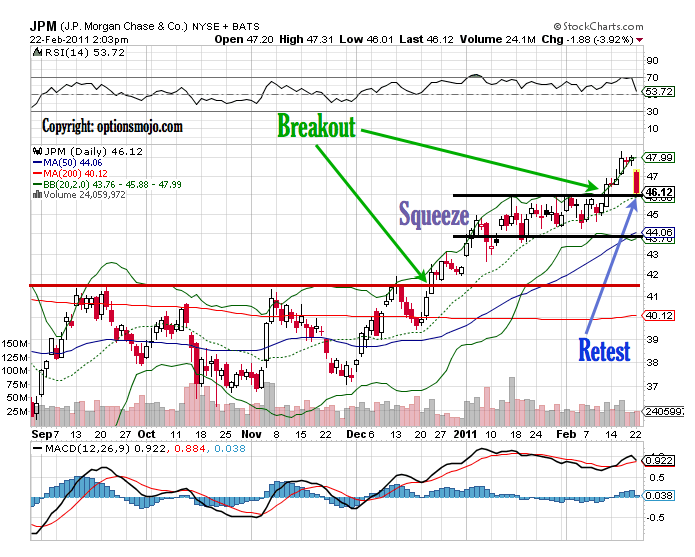
On Feb 11, 2011 JPM broke out of its volatility squeeze and traded up to the 48-range. Today, after ~ 4% correction (along with the broader market due to unrest in Libya), JPM is trading close to the 46-level, the pivot point for the breakout! This also happens to be the place where its 20-day MA resides (45.88 at the time of writing).

I think JPM goes higher from here if this 46-level can hold. One can go long JPM at this level, if bullish on the name. But keep an eye on the price action of JPM around this 46-level.

Given the possibility of further correction in the broader market (and hence JPM), if you want a low-risk trade, you can go long the March 46/47.5 Bull Call Spread for ~ 0.67 debit with max potential gain of (1.50-0.67)=0.83 (minus commissions) if JPM trades at or above 47.50 by March expiration. Alternatively, one can go long April 46/49 for 1.20 with max potential profit of 1.80 (minus commissions) if JPM trades at or above 49.00 by April expiration.

Posted in Individual Stock Chartology | 2 Comments

Be with DE

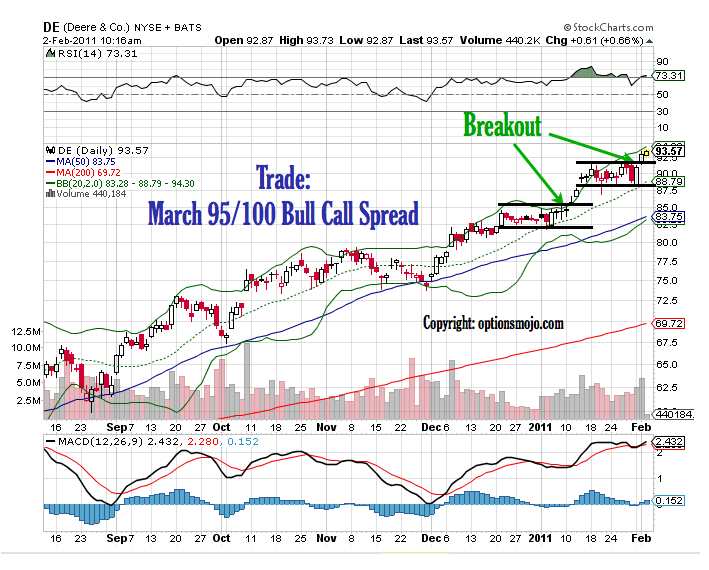
In order to satisfy rising global food demand, the farming industry relies on companies such as Deere & Company (DE). The stock is at a decent buy point and has the potential to test the 100-level.

We like the March 95/100 Bull Call Spread where you Buy the March 95 Call and Sell the March 100 Call. Net debit is $1.80, which is the max loss. Max gain of $3.20 will be realized if DE trades at or above 100 by March expiration, giving a ~180% return (minus commissions).

DevTrade (Full Disclosure: Author long DE Call spreads at the time of writing)

Posted in Individual Stock Chartology | 2 Comments

Time to buy BAC Again?

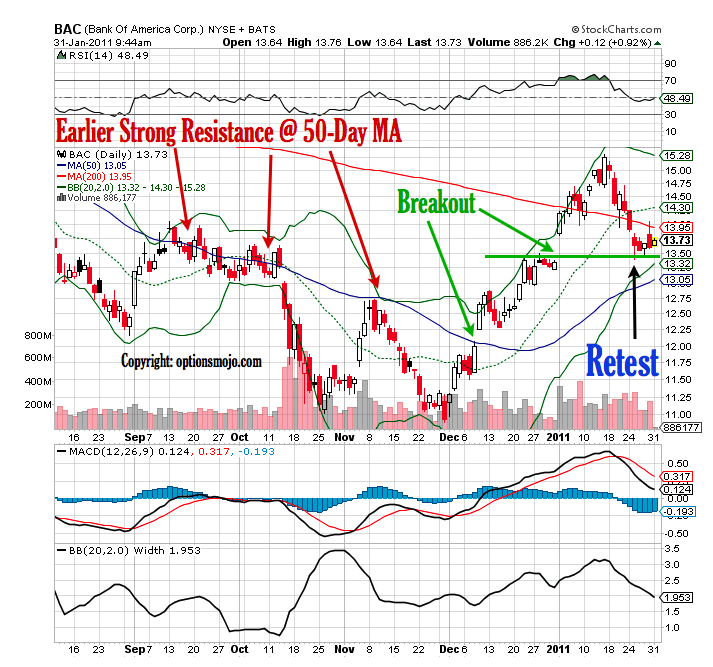
We originally initiated our position in BAC on Dec 09, 2010 when it broke out of the 50-day moving average (after a long downtrend). We were right! The stock then ran up more than 25% up to its earnings release. On Jan 20, 2011 we mentioned in our post that, given the run up in the share price, it would be prudent to book some profit (and suggested a stock replacement strategy). We were right again! The stock has pulled back quite a bit since the earnings release.

The recent price action in the share price tells us that it might be the time to get long BAC shares again! Over the last couple of trading days, BAC shares have been able to hold the 13.50 level (please refer to the attached chart).

Investors bullish on BAC can go long. However, if it breaks the 13.50 level, it can easily test the 50-day MA which is at 13.05. So a stop-loss underneath 13.30 or 13.00 would be prudent.

DevTrade (Full Disclosure: Author long BAC Calls at the time of writing)

Posted in Individual Stock Chartology | 1 Comment

AMZN Calendar to take Advantage of Elevated Implied Volatility

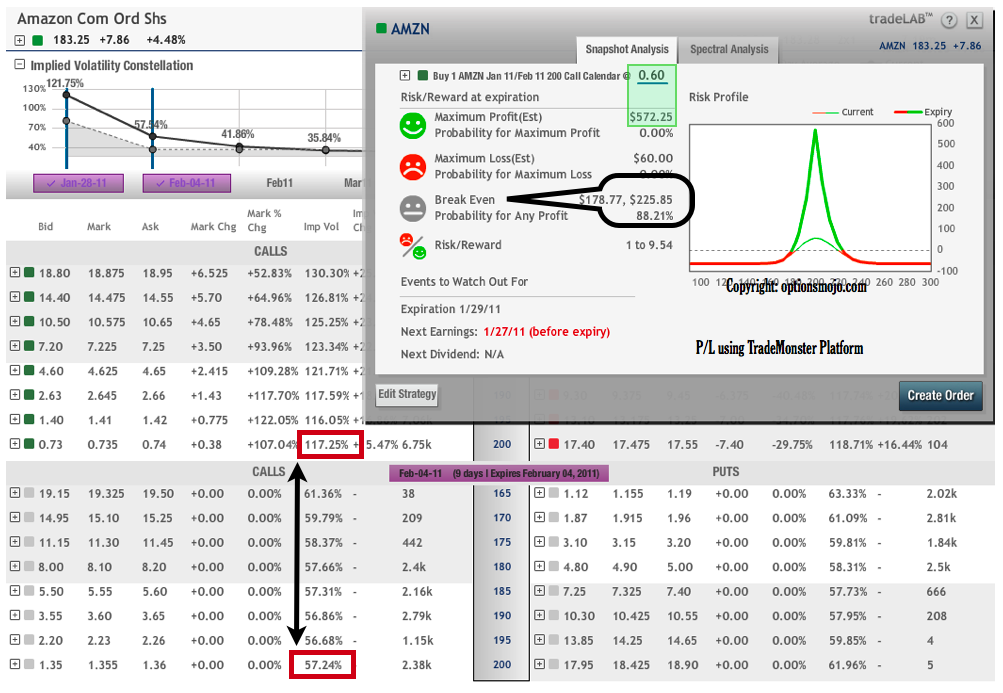
Amazon (AMZN) will report earnings today after the market close. The Jan options expire tomorrow and has tremendously high implied volatility (IV).

If you are bullish on AMZN shares, but want to put on a trade that would take advantage of the high implied volatility (and may position yourself for a nice rally into next week), then you can do the following trade.

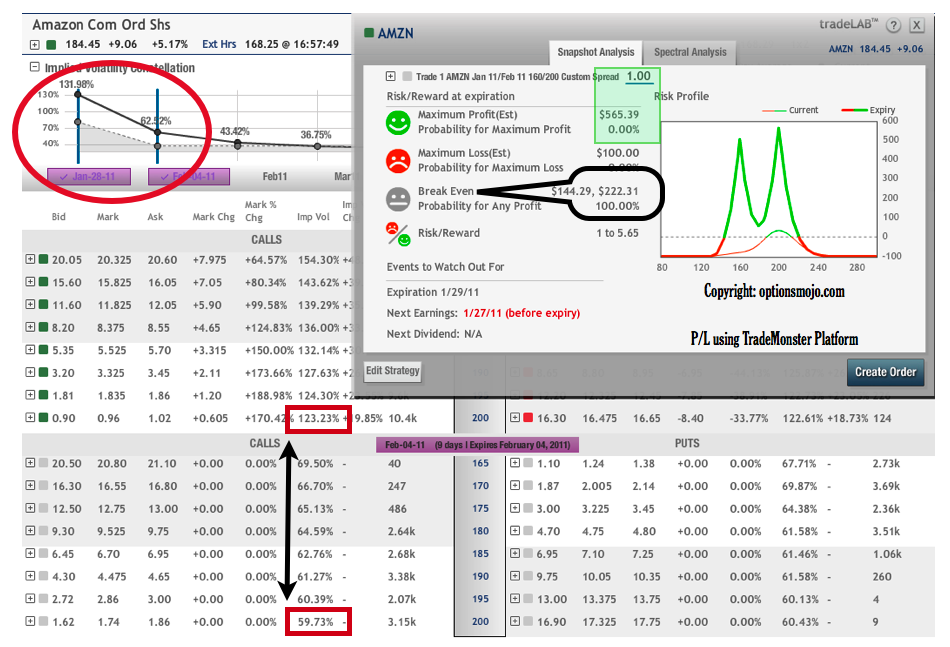
The trade: Jan weekly/Feb weekly Calendar spread. Sell the 200-strike CALL expiring tomorrow and buy the 200-strike CALL expiring next Friday. The trade is most profitable if AMZN trades at 200.00 by 4:00 PM tomorrow with 1 to 9.5 risk/reward.

What if you are not sure about the direction but want to take advantage of high IV? Please consider the following:

You could do a similar trade on both the CALL and PUT sides with a risk/reward 1 to 5.65! You make the most money if AMZN trades at either 200 or 160 by 4:00 PM tomorrow.

DevTrade (Full Disclosure: Long Jan weekly/Feb weekly Calendar spreads (Call and Put) at the time of writing)

Posted in Individual Stock Chartology | 2 Comments

Hail HAL

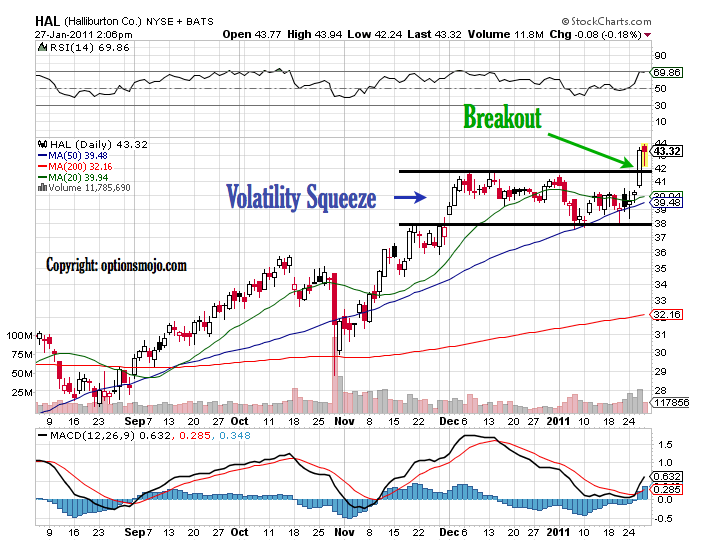
Halliburton (NYSE:HAL) reported better than expected earnings this week and received a number of analysts’ upgrades.  Technically, the stock broke out of a volatility squeeze yesterday on heavy volume. We think the stock has further upside from here.

Noting that the S&P500 is flirting with the 1300 level at the time of writing, and might feel a little extended, one can take a conservative position by initiating the 43/45 Call spread expiring on Feb 18. The spread can be bought for 75 cents debit, with a maximum potential profit of 1.25, if HAL trades at or above 45.00 by Feb expiration.

– DevTrade (Full Disclosure: Long Feb 43/45 Call spread in HAL at the time of writing)

Posted in Individual Stock Chartology | 5 Comments

Is Morgan Stanley (MS) Back in Action?

Morgan Stanley reported better than expected earnings yesterday and after testing a low of 27.59, rallied all day to above 29. The technical setup looks bullish and it is already up 2.5% this morning. Although it is a little hard to initiate a new position right here after such a run up… I do believe it has further upside. One an take a small position now and then add to it depending on the price action. A stop-loss at 27.50 should be in place.

– DevTrade (Full Disclosure: Long MS Feb 29 calls at the time of writing)

Posted in Individual Stock Chartology | Leave a comment

Managing two of our winners (BAC and GE) as we head into earnings (tomorrow morning)

Hello Everybody,

First of all… wish you all a Happy New Year! I had to go through a surgery (at the beginning of the new year) on my hand to fix lacerated index finger extensor tendon. Hence I could not post on the blog for a while.

The great news is that all our trades have been working out great! Today, I would like to focus on BAC and GE (both reporting their earning tomorrow morning before the market opens).

We initiated our position in BAC on Dec 09, 2010 when it broke out of the 50-day moving average. Since then, the stock has run up more than 25%. If you actually had bought the Feb 12 calls, you have made much more than that. Given the run up, we will not be surprised if it pulls back post earnings. If you are holding BAC shares and do not want to sell your core holdings, you may consider buying the 14-strike weekly PUTS (expiring on Jan 28, 2011) as protection. If you want a stock replacement strategy, you can sell your BAC shares at ~ 14.50, thus locking in your profit, and use part of the proceeds to buy the 15-strike CALLS expiring on Jan 28, 2011 (weekly options) for ~ 20 cents (i.e., 20 USD per contract). If you had bought the Feb 12 CALLS, you may consider rolling those over to the 15-strike CALLS expiring on Feb 18, 2011.

We initiated our position in GE on Dec 10, 2010 when it broke above the resistance in the 17.50 area. It has since gone up ~ 6%. You can either buy the 18-strike PUTS expiring on Jan 28, 2011 (weekly options) or do a stock replacement by selling your GE shares and buying the 19-strike CALLS expiring on Jan 28, 2011 (weekly options) for 20 cents (i.e., 20 USD per contract) or 19-strike CALLS expiring on Feb 18, 2011 (lower IV) for 30 cents (i.e., 30 USD per contract).

We will monitor these positions tomorrow after earnings release.

– DevTrade (Full Disclosure: Long BAC and GE calls at the time of writing)

Posted in Individual Stock Chartology | Leave a comment