What next after a healthy retest of breakout?

We discussed in our last post how the market was ripe for a breakout. After the breakout from the 1225 level, market has retested that level on Tuesday, and has rallied over the last couple of days. This is a good sign. However, we are still under the 200-day moving average.

A better-than-expected Nonfarm Payroll number tomorrow morning can boost the market above its 200-day moving average. We should keep close eye on the 1270-1280 range. There can be significant resistance there. Either way, I have a slightly positive bias, but with caution. I will soon post some conservative options strategy ideas for the rest of the year.

Posted in Broader Market Analysis | Leave a comment

What can take us out of “The Range”?

We have witnessed (and were able to trade) the range-bound movement in S&P500 over the last couple of months. S&P500 closed today near the upper end of the range. Can we break higher? Or are we headed back down?

We have both EU developments and Domestic Earnings that will shape up the next leg of the move. I would watch the move in the market closely over the next couple of days to see whether we can break the range.

Since VIX went down ~ 30% over the past few days, primarily long investors might want to buy PUTS to protect their portfolio, even though I am slightly bullish.

Happy Trading!

Posted in Broader Market Analysis | Leave a comment

Can we be Bullish on The Market?

Since the S&P500 bottomed over a period of four days (Aug 8-11), we have seen higher highs and higher lows (as is shown with the green parallel lines). The market needs to hold this level for it to go higher in the short term.

It is hard to be completely bullish at this stage. Bullish investors could think of the following strategy: Oct 1150/1250 Call Spread.  This strategy is good as the Volatility is very high at this point.

Posted in Broader Market Analysis | Leave a comment

Having a hard time to cross 1200 on S&P500…

On Aug 11, 2011, I had mentioned on my post that S&P500 has probably found a bottom. The market, since then, has rallied ~ 7%. But it is not able to cross the 1200 mark on S&P500. I think, at this point, one should either protect their portfolio or move to the sidelines and wait until we close above this level for a couple of days.

Posted in Broader Market Analysis | Leave a comment

Has S&P500 found a bottom?

Well… we did have a rough few days of trading… If you look at my previous post, I did mention that testing the 200-week MA was in the cards. There is something interesting I want to note today. If you take a look at the 1120 level, we have been able to hold support there over the last couple of days of choppy trading. Can it be a sign of the bottom? Maybe. Maybe not. Bullish investors can go long here with stop underneath the 1120 (or maybe 1100) level on S&P500.  We can then participate in the upside (if any) and at the same time limit our losses to the minimum if there is further downside.

Happy Trading!

Posted in Broader Market Analysis | Leave a comment

Where are we headed after Yesterday’s Capitulation?

Yesterday it felt like Market was going to test the 1200 level on S&P500 and it did. The next logical support is at 1157 area (200-MA) and then at 1100. Today’s better than expected unemployment number might help slow down further downturn. If you want to go long, do it with stop underneath 1200 as if we break it we can easily test the 200-MA (see above chart) or 1100 level.


Posted in Broader Market Analysis | Leave a comment

Where is S&P500 Headed After Payrolls Data?

The market staged quite an impressive rally (after holding support at the 1260 level) over the past few trading days. The attached chart shows where the market closed on July 07, 2011, the day before the release of June Payrolls numbers.

With SPX hovering around its prior resistance, it would have needed a solid job growth picture painted this morning to further this rally. With the dismal data released this morning, one should seriously re-consider their long positions at this juncture.

It might be prudent to move to the sidelines and get longer again when SPX moves above the 1350 level again.

Posted in Broader Market Analysis | Leave a comment

Adjusting Our WFMI Call Spread

We have been enjoying the ride in Whole Foods Market Inc. (WFMI) shares from November 30, 2010 (WFMI was trading at 47 and change back then; please check: http://optionsmojo.com/2010/11/volatility-squeeze-in-whole-foods-market-inc-wfmi/).

More recently, on March 16, 2011, we initiated further long position in WFMI via May 60/70 Bull Call Spread for a net debit of 3.00 (WFMI was trading at 60.15 back then; please check: http://optionsmojo.com/2011/03/wholehearted-support-for-whole-foods-market-inc-wfmi/). Since then, within the past couple of weeks, we have realized ~ 100% gain in this spread (the spread is worth ~ 6.00 now).

I suggest selling the 60-strike call and buying the 65-strike call, for a net credit of 3.50, thereby taking our original dough (plus 50 cents profit) off the table and playing on the house-money. After this swap, you will be left with a 65/70 call spread in May for WFMI.

Posted in Individual Stock Chartology | Leave a comment

An Important Juncture for Bank of America (BAC) Stock Price

Back in December 2010, we initiated a buy when BAC crossed above its 50-day moving average (which was resistance for BAC shares for a long time). BAC did run up ~ 25% from the breakout price of 12.xx. Recently, the shares have reversed their course and moved below the 50-day MA again! It is now trading just above its 100-day moving average. I wanted to point out a very important juncture for BAC. 13.30-13.35 level should be a quick support for the stock. If it can not find good support at the 13.30-13.35 level, it could head much lower that that. So please watch out.

Posted in Individual Stock Chartology | Leave a comment

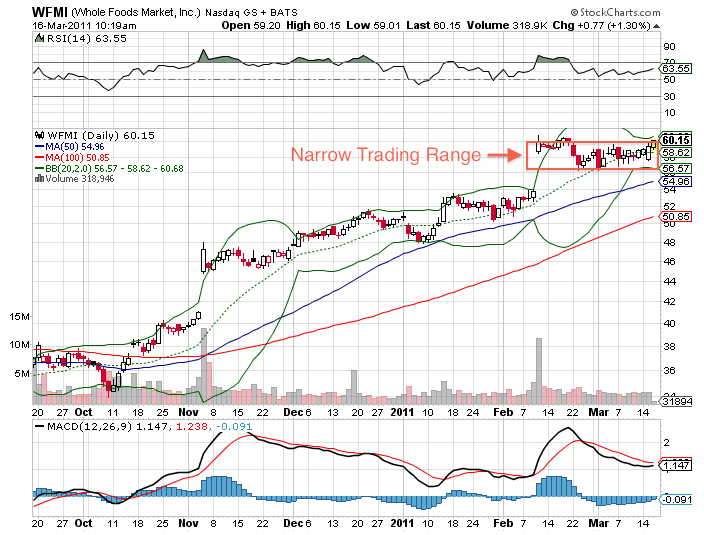
Wholehearted Support for Whole Foods Market Inc. (WFMI)

Whole Foods Market Inc. (WFMI) is one of our most profitable positions here on optionsmojo. We initiated our long position on November 30, 2010 when WFMI was trading at 47 and change (please check: http://optionsmojo.com/2010/11/volatility-squeeze-in-whole-foods-market-inc-wfmi/). Since then, we have seen great upside and the stock still looks extremely strong!

In the recent weeks, the broader market has given up ~ 5% from its recent highs. However, WFMI has been trading sideways creating a volatility squeeze. I think WFMI has a lot of upside from here. One can get longer here by either buying more stocks or getting long MAY 60/70 Bull Call Spread for a net debit of 3.00. The maximum profit for this spread is 7.00 (if WFMI trades at 70 my May expiration), with a 1/2.3 risk/reward.

(Full Disclosure: Author long WFMI Calls at the time of writing)

Posted in Individual Stock Chartology | 1 Comment