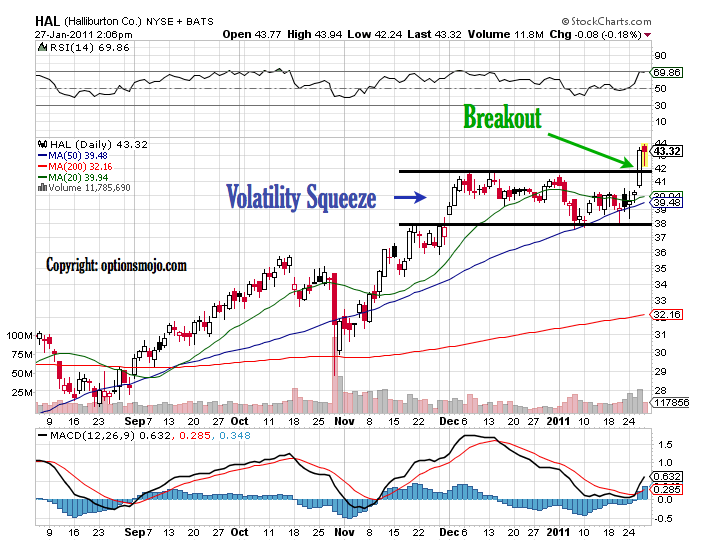
 Halliburton (NYSE:HAL) reported better than expected earnings this week and received a number of analysts’ upgrades. Technically, the stock broke out of a volatility squeeze yesterday on heavy volume. We think the stock has further upside from here.
Noting that the S&P500 is flirting with the 1300 level at the time of writing, and might feel a little extended, one can take a conservative position by initiating the 43/45 Call spread expiring on Feb 18. The spread can be bought for 75 cents debit, with a maximum potential profit of 1.25, if HAL trades at or above 45.00 by Feb expiration.
– DevTrade (Full Disclosure: Long Feb 43/45 Call spread in HAL at the time of writing)

What is volatility squeeze and how do we recognize it here looking at the chart? Apart from the breakout, how does volatility squeeze instill more bullish picture here?
Also, the max profit of this is 66% possible gain, correct?
Thanks!!
Vish
Hello Vish…
When Bollinger Bands are far apart, volatility is high, and when they are close together, it is low. Technically, a squeeze is triggered when volatility reaches a six-month low and is identified when Bollinger Bands reach a six-month minimum distance apart. However, here I have used the term to notice that HAL has been trading sideways for a while.
The breakout is the technical indicator for the bullish case. The fundamentals are also really strong. However, the price will have some correlation with the oil-price.
Maximum profit is (1.25/0.75) = 166%
Hope that helps!
DevTrade
Furthermore: please exude a list of all companies you are following. This may make our skill growth easier
So with the bollinger bands overlayed onto the chart, it appears around ~Dec 31, 2010, the bands in fact did draw really close together. So when this occurs, we say it is a vol squeeze? What are some possible implications of a vol squeeze? Does it necessarily mean there could be a break-out in either direction from the sideways trading? One of the overlays on stockcharts.com is called Bollinger Bandwidth. With this overlay, how am I supposed to interpret the results? It seems the overlay lags the bands themselves. Am I reading this wrong?
Also, is it too late now?
Where are you viewing the volatility (including the historical fluctuations)?
Dear Vish:
“it appears around ~Dec 31, 2010, the bands in fact did draw really close together. So when this occurs, we say it is a vol squeeze?”
-Yes! Correct!
“What are some possible implications of a vol squeeze? Does it necessarily mean there could be a break-out in either direction from the sideways trading?”
– Yes again~! Because there is a limit to the amount of time a stock would trade sideways. But as long as it trades sideways, we should respect that. When it breaks out in either direction, we take action!
“One of the overlays on stockcharts.com is called Bollinger Bandwidth. With this overlay, how am I supposed to interpret the results?”
– I will include the bands from now on… when the bands starts to widen… you get the feel that the stock is trying to break out!
“It seems the overlay lags the bands themselves. Am I reading this wrong?”
– I am sorry but I do not think I understood that statement.
“Also, is it too late now?”
– NO! Still lot of upside move expected!
“Where are you viewing the volatility (including the historical fluctuations)?”
-See the recent BAC chart. you can have an extra panel with the BB-width.