To avoid any conflict of interest, No further posts on Optionsmojo

Dear Everybody!

I started this blog in November 2010 when I was a postdoctoral research fellow in Physics. My main goal was to increase our understanding of financial markets and trading via exchange of trade ideas and market commentary.

I have recently changed my career path. I have joined an Investment Bank as a Strategist in the Fixed Income Division.

In order to prevent the misuse of confidential and material non public information, I will not post any trade ideas/market commentary going forward.

Happy Trading!

Posted in Broader Market Analysis | Leave a comment

Is it time yet to go long the market?

Dear Everybody!

We have benefited a lot from the ~ 13% rise in S&P500 index from the beginning of this year to the beginning of May.

Sell in May and Go Away?

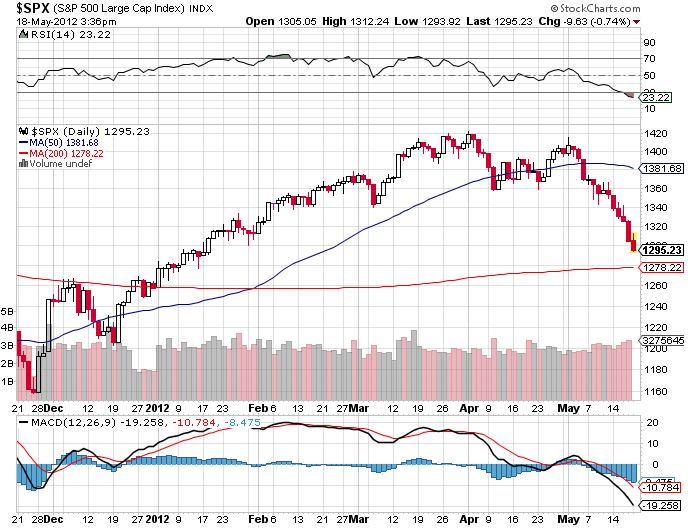
From the intraday high of 1415 on May 01, 2012, S&P500 index has fallen ~ 8.5% so far to  1295 at the time of writing this post. The VIX has rallied more than 55% in the same time period, showing the amount of fear in the marketplace. S&P500 trading down to 1270-1280 range would mark a 10% correction. This is also where the 200-day moving average sits.

We think it might be getting close to the time to start getting long the market again. However, We can not ignore what is going on in the Europe and the slowdown of the recovery here in the US. So we would like to build positions slowly.

Also, even though VIX has rallied more than 55% in the past couple of weeks, we think long positions should be accompanied with put spreads as a hedge.

Posted in Broader Market Analysis | Leave a comment

FOSL Trade Analysis

On Feb 10, we initiated a Feb/Mar Calendar Spread Trade on FOSL. Since today was Feb expiration day, I thought it would be worthwhile to analyze how we did on that trade.

First of all, we were right about the direction of the move but underestimated its magnitude (our estimate was ~ 10%). FOSL rallied ~ 20% post earnings on Feb 14.

Our trade was still profitable. FOSL closed today at 118.19. Thus the call we were short was worth 8.19 at today’s close. The Mar 2012 110-strike call we were long was worth 10.30 at today’s close. The difference (10.30-8.19) = 2.11 is higher than our original debit (1.40), leaving us with a profit of (2.11-1.40) = 0.71 minus commissions. Thus, even though we were wrong about the magnitude of the move, we still made ~ 50% profit in 7 days.

(I am assuming we all closed our Mar 2012 110-strike long call position)

Posted in Individual Stock Chartology | Leave a comment

Call Calendar Spread on FOSL Prior to Earnings Release

Event:

Fossil, Inc. (FOSL) is scheduled to report its quarterly earnings before market opens on Tuesday, Feb 14, 2012.

Thesis/View:

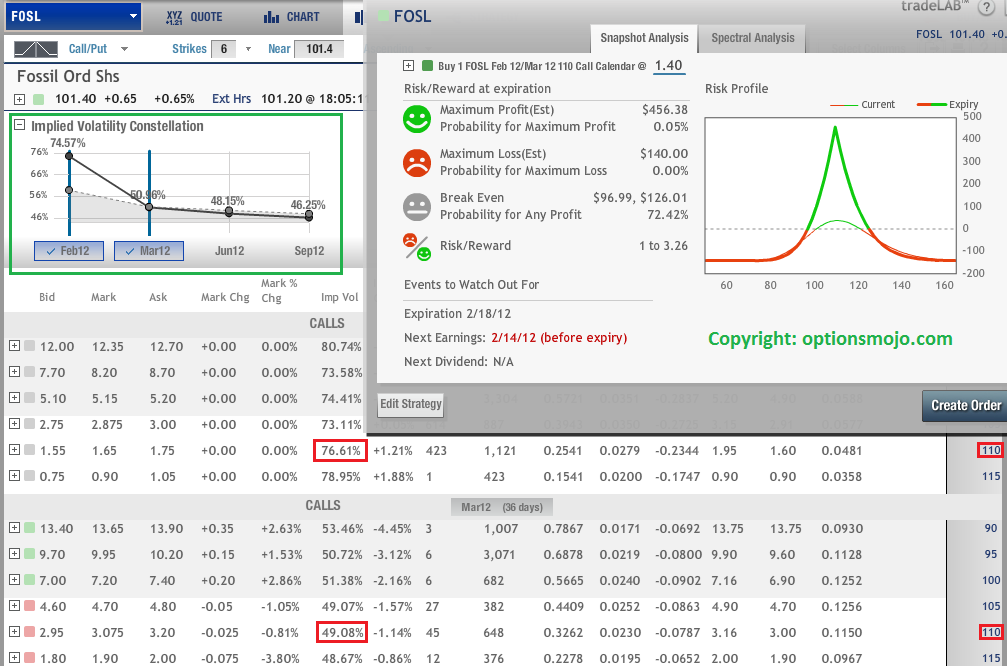
The market is pricing in ~ 8.5% move (one can look at the ATM straddle to calculate the expected move) after FOSL’s earnings release. We are bullish on FOSL’s earnings but do want to take advantage of the elevated implied volatility of FOSL in Feb (~ 77%) compared to March (< 50%). This is a short-term trade.

Trade Structure:

We would like to sell the Feb 110 strike call and buy the March 110 call, thus creating a calendar spread for a net debit of $1.40.

The above plot describes the P/L for the trade. We describe it in more details below.

P/L:

The P/L described in the plot assumes that the long position is also liquidated by Feb expiration. The max loss in this trade is the initial debit of $1.40.  The max profit is $4.56, giving the trade a 1 to 3.26 risk/reward. The max profit will be realized if FOSL trades at 110 by Feb expiration.

Further Insight:

We expect the stock to rally after earnings but do not expect it to cross 110 by Feb expiration. That is why we chose the 110 strike. After the post-earnings move is realized, and if FOSL trades below 110 by Feb expiration, an investor can either close all the positions or continue holding the long call position.

Posted in Individual Stock Chartology | Leave a comment

SPY Put Ratio Spread

Happy New Year Everybody! Wish you all a fantabulous year ahead.

We had a great year in 2011 in terms of trading (even though the S&P500 index closed Flat for the year). Hope we will continue to be profitable in 2012.

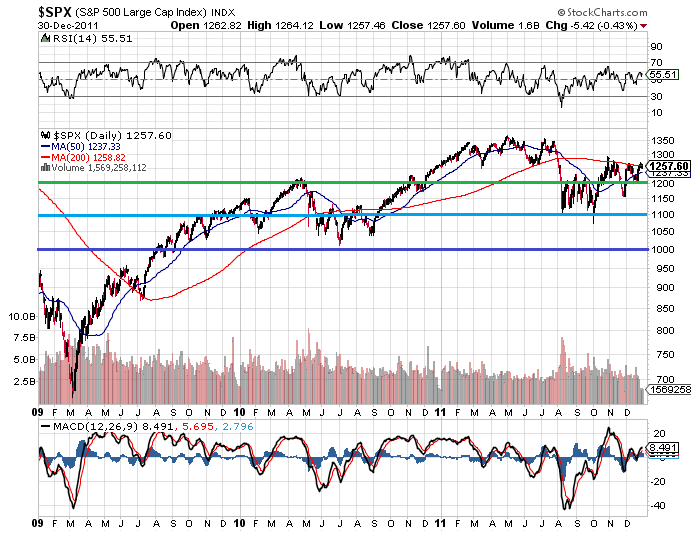
Before I discuss our first trade for 2012, let me discuss my broad outlook. Although I do believe that the US economy is showing signs of sustained recovery and 2012 could be a good year for the market, we have to be careful about situations in Europe and possible weakness in the marketplace due to contagion effects (primarily given the fact that our portfolio is net long).

The following trade makes money if the market rallies, stay flat, or turns south!
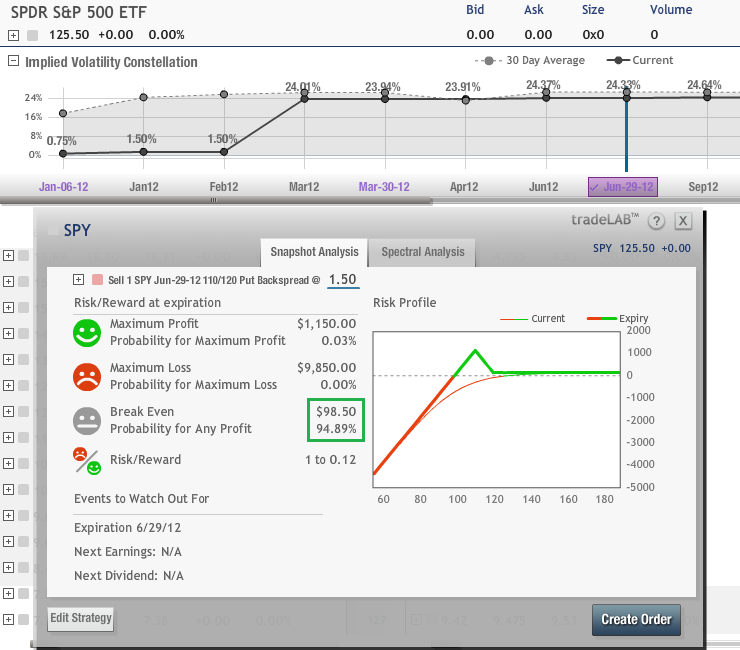
The Trade: I suggest a 120/110 put Ratio (1/2) Spread on SPY expiring on June 29, 2012 (quarterly). We collect a premium of $1.50.

Details of the Structure:  Buy 1 Put with Strike price 120. Sell 2 Puts with strike 110.
 

Profit/Loss:

As you can see from the above P/L analysis, if S&P500 trades flat or rallies from its current level (~1260), and stays above 1200 by June end, we get to keep the $1.50 premium collected.

If S&P500 trades down to 1100, we make our maximum profit of $(120-110)+$1.50 = $11.50. If S&P500 trades below 1100, our profit starts to decrease as we are short 2 puts with K=110. However, we do not lose money until S&P500 reaches 985, which is down more than 20% from the current level. Moreover, if S&P500 trades at 985, I would not mind getting long the market as it would seem pretty cheap at that level. This is a also high probability trade.

Happy Trading in 2012! Good Luck!

Posted in Broader Market Analysis | Leave a comment

Revisiting our SPY Straddle Trade

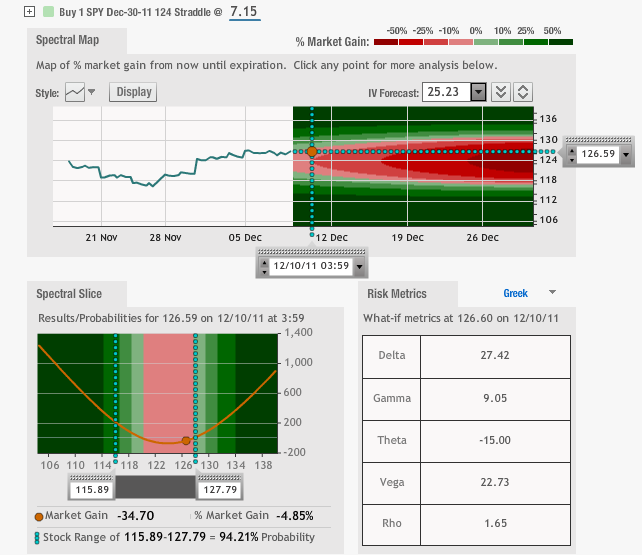
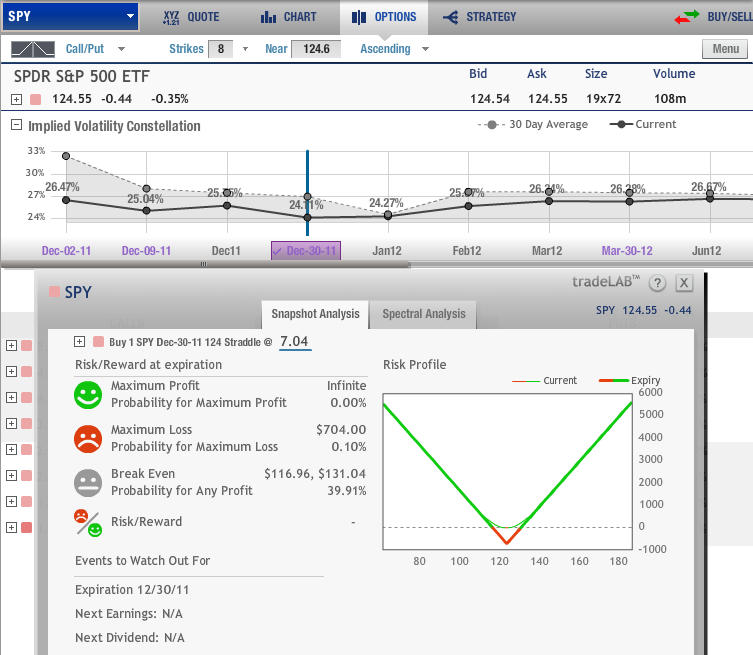
Exactly a week ago, we had initiated a long Straddle position on SPY (Dec Quarterly) with strike price 124. Our original cost was 7.04. The straddle currently has a market value of 7.15 (see above).

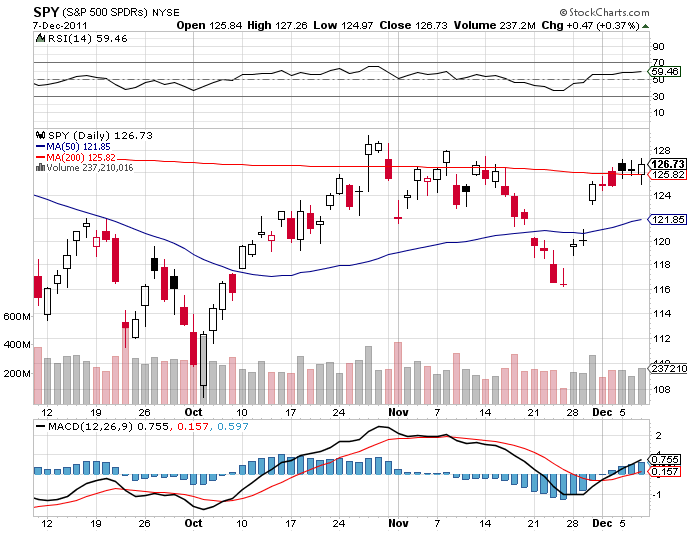
Below is a chart of SPY. It has been trading sideways over the past couple of days as traders wait to see the outcome of the Summit: European leaders will meet Thursday and Friday to try to work out a deal to ease the financial crisis.

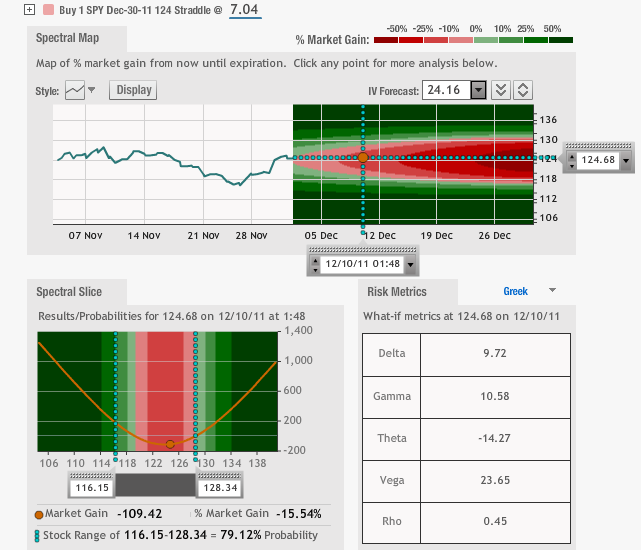
Since our long straddle position has a high negative “Theta” (please refer to the spectral map and the Greeks table), a sideways move in the market in bad for this trade. However, we are at a juncture where a large move can be expected any time this week. We will closely monitor this position over the next two trading days and, if we do not see any large moves in the market, will roll over this trade to Jan 2012 (as further away expiry date will decrease the loss due to theta in the near term).

Posted in Broader Market Analysis | Leave a comment

A Long Straddle on SPY (Dec 2011 Quarterly)

On November 28, we took off our hedge (VIX Call spread) and enjoyed a nice rally over the last three trading days. VIX has dropped to 27.75 at the time of writing this post.

Current Thesis:

S&P500 is trading close to the upper end of the trading range we have seen since Aug 2011. Further good news out of EU and good economic numbers here is the US might provide fuel to take the market higher from here. However, situation in the EU is still vulnerable. Also, important payroll number is expected tomorrow morning. I have a feeling that the VIX is cheap at this point, given the drastic market moves we have seen recently.

The Trade:

At this stage, I suggest a Long Straddle on SPY with strike price  124.00. The Straddle can be bought for 7.04 (which is the maximum loss associated with the trade). The maximum profit is unlimited. The break-even points are 117 and 131 on SPY by Dec 30.

The following spectral analysis depicts that if the market trades flat, this trade will not be profitable as we are long vega. We will closely monitor this trade and will take it off if the value of the straddle falls below 4.50.

Posted in Broader Market Analysis | Leave a comment

Update on Call Spread on VIX

Greetings!

Hope you all had a Happy Thanksgiving Break.

On Nov 11, we had initiated a 30/40 Call Spread on VIX for 2.25. As of the close on Friday, VIX was trading at ~ 34.40 and the spread was worth 3.50, up ~ 55%.

Over the weekend, European leaders were exploring more drastic methods to bring Europe’s debt crisis under control. Also, consumers came out in droves, boosting retail sales over the Thanksgiving weekend. The S&P500 E-Mini Futures are trading up ~ 30 points. At market open, I do expect the VIX call spread to still have some decent profit. It might be a good idea to take it off unless you are too long in the market.

Posted in Broader Market Analysis | Leave a comment

Call Spread on VIX

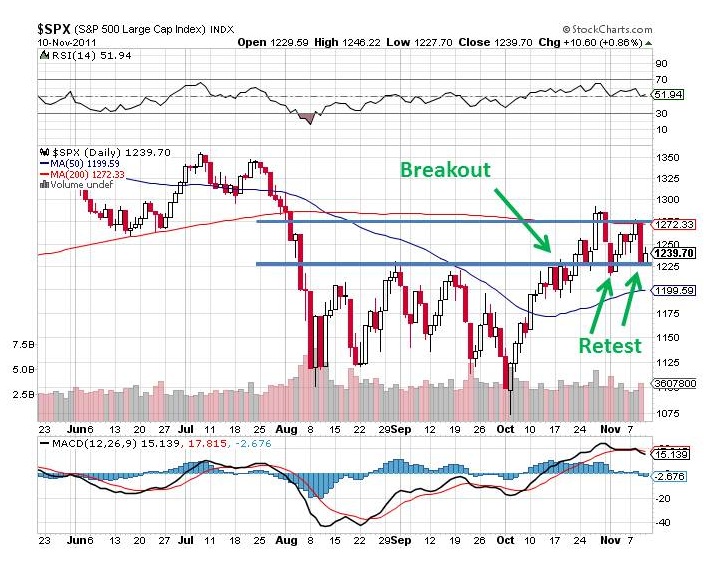
As we discussed yesterday, the market is at a very critical level right now. Although some good news out of EU can help fuel the next leg up, we have to be careful also about the potential downside.

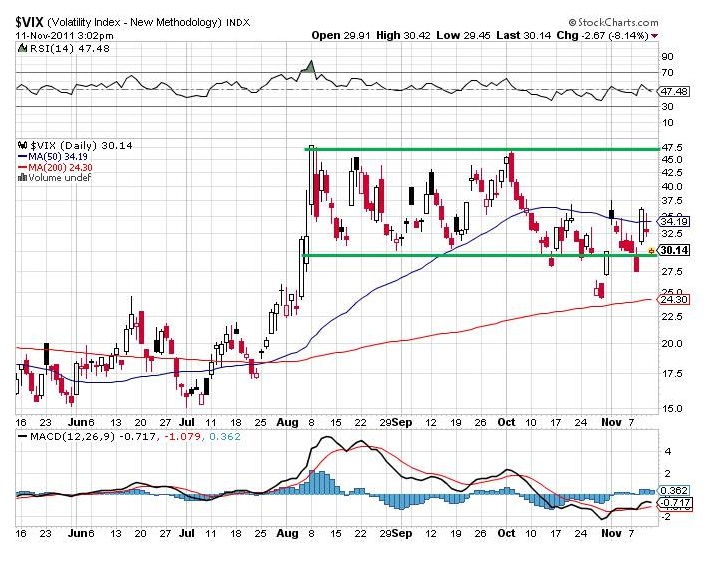
Since the beginning of August, the VIX has traded in the 30-45 range for the most part. There is a good chance that the VIX might trade down to the 25-level in near term. However, since our portfolio is net long the market and VIX is currently trading at 30, I suggest a Dec 2011 30-40 Call Spread on VIX. One can buy the call spread for 2.25 now, which has a maximum potential profit of 7.75 (~ 340%) in case the *fear index* jump up significantly. We are looking at it as a hedge against our long portfolio at this point.

Posted in Broader Market Analysis | Leave a comment

We tested 1225 Again! Watch out for any break below!

In my last post, I discussed the 1225-1275 range. In one day of trading yesterday, the market went down from roughly the top of that range to the bottom. The 1225 level is still holding. So we are still net long. We will get long VIX if the 1225 level is breached tho.


Posted in Broader Market Analysis | Leave a comment